
USD/JPY: A Symphonic Dance of Policy & Politics
Picture the dollar and yen as two dancers on a global stage. Right now, the dollar is pulling ahead, propelled by a fresh burst of force from the United States while the yen sinks into a kind of slow‑motion slump, thanks in large part to the Bank of Japan’s unwavering low‑rate attitude.
Why the Dollar Keeps Walking (And Sprints) Ahead
- Retail sales did better than expected. After the U.S. economy reported a 0.6% jump in sales—well above the 0.1% forecast—traders started to think the fed won’t cut rates in September. The certainty around having to keep tightening is like a splash of water that keeps the dollar buoyant.
- Yield differential. The interest‑rate spread between the U.S. and Japan remains a heavy‑handed influencer. A larger spread means the dollar has more “escape routes” to climb higher.
Is the Dollar Breaking Through the Psychological Ceiling at 149.15?
We’re approaching a key psychological barrier. If the U.S. keeps delivering strong stats and Japan doesn’t magically improve its fundamentals, we could see the pair breach 149.15. That would set the stage for the next spell of price action—maybe hitting 149.30 or even the sweet spot of 150.00 if we hear more hawkish words from Fed officials.
The Yen’s Slow Freefall – Behind Closed Doors
The Bank of Japan’s insistence on ultra‑low rates is like a magnet pulling the yen down. But the real drama unfolds in Tokyo’s political waters:
- Upper House election looming. Japan’s next election could send bond yields shooting up as investors worry about what the new government will do.
- Debt‑driven fiscal model. Japan’s debt-to‑GDP ratio is among the highest worldwide. Without a clear reform plan, the sovereign credit rating could take a hit—turning the bond market into a tightrope walk.
- Consumption tax cut talk. Lowering the tax from 10% to 8% may look good on paper for voters, but the deficit that would grow by ¥7–10 trillion could cause the yen to wobble and push yields further.
Prime Minister Shigeru Ishiba’s “No‑Borrowing” Promise
He’s sweet‑talking that he won’t finance any tax cuts with more borrowing. That’s reassuring in theory, but without a concrete plan, markets remain wary. A slight dip in yields might happen, but the overall trajectory stays uncertain.
Bond Market Shake‑Up: The Mini Crash Allergy
Post‑election, we could see a 5–10% slide in bond prices within the next two weeks—especially if the new government delivers a vague or expansionary policy speech. That would likely force the Bank of Japan to step in again and revisit its easing plans.
Global Ripple Effects? Absolutely!
Japan’s bond market is a big fish. If investors start doubting its fiscal health, we could see a global yield surge that includes high‑debt countries like Italy and France. Emerging markets might feel the sting through capital flight and higher borrowing costs.
In a Nutshell – The USD/JPY Game Plan
- The dollar’s rise is a natural consequence of continued U.S. strength and a widening yield gap.
- The yen’s decline stems from Japan’s ultra‑low rates, political uncertainty, and possible fiscal imbalance.
- As long as the policy divide stays sharp, the USD/JPY will keep trending higher, but the pace will hinge on what happens in Japan’s political arena.
So grab your popcorn and keep an eye on Tokyo. The next moves might bring more drama and a few more surprises.
Technical analysis of ( USDJPY ) prices
USD/JPY Near a Crucial Psychological Spot
Right now, the USD/JPY pair is hovering just a hair away from the big 149.15 level. Think of it as a mental line in the sand where the market both feels the pressure and the traders feel the suspense.
Why 149.15 is the Big Deal
- Fibonacci Magic: It sits smack on the 50% retracement point of the fall from January’s highs to April’s lows. Basically, it’s the halfway mark where traders love to place bets.
- Multiple Technical Signals: Different chart patterns and oscillators all point to the same spot, turning it into a hot‑spot for reaction.
- Psychological Weight: Numbers that round off (like 149) often stick in everyone’s heads, making them extra important.
What Should Traders Watch For?
If the pair punches above this 149.15 threshold—especially with a big surge in trading volume and a high‑speed momentum spike—it could set off a new buying spree.
That spree might push the price to the historic 150.00 mark, a level that’s often a battleground for bulls and bears alike. It’s a key short‑term resistance point that’s been a source of drama for traders for years.
Bottom Line
Keep your eyes on that 149.15 line. If traders move past it with sizzling momentum, the 150 mark could get the next round of action. Whether this marks a new surge or just a fleeting sprint, it’s a moment worth tracking!
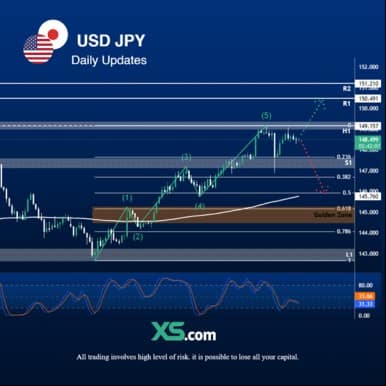
Quick Take: What’s Happening on the 4‑Hour Pivot?
Imagine the market as a surfer riding the 4‑hour swell. The latest wave cycle shows a classic five‑wave pattern—Elliott Wave style, if you like your charts with a splash of theory. That means the pullback we’re seeing might just be a tiny pause before the next big ride.
Bull‑ish Outlook: The Upside Playbook
- Break out at 150.00? Then the next sweet spot could be 151.62—the 61.8% Fibonacci retracement. Think of it as the market’s “shh, let me finish” moment.
- After that bump? 154.82 is in the cards—aligning with the 78.6% retracement. That’s where the medium‑term goals land.
- Momentum clues? The stochastic oscillator (yes, we’ve got a little mood board right on the chart). It has been clawing out from oversold territory and seems primed for a bullish crossover—so if the price holds above 150, the trajectory looks high‑energy.
Bear‑ish Scenario – Stay Alert!
If the price can’t hang on over 149.00, we might see a slide right into the 38.2% Fibonacci support at 147.14. That spot is not just a line on a chart; it’s a “previous bounce” that backs up our short‑term defense.
- Down below 147.14? The 50‑day SMA sits around 145.14—a natural fence. Keep a close eye; a dip here could bring the 23.6% retracement at 144.37 into play, a spot known for solid reversal drama.
- Good news? The 10‑day SMA is still topping the 50‑day line, which means the short‑term vibe is still bullish.
- Last call: The next big move hinges on the price’s reaction to the 149.15 resistance. Mark your calendars—you’ll want to see what the pair does next.
Key Levels to Watch
- Support: 147.14 → 145.14 → 144.37
- Resistance: 149.15 → 150.00 → 151.62
Want the freshest updates right on your phone? Subscribe now.

