
Bond Market Gets a Little Jerk – Yields Take a Tiny Lift
Today, Wednesday, the bond market felt a pinch and saw yields inch up by a smidge. The 10‑year U.S. Treasury sits at 4.28 %—just nudging from last week’s 4.256 %. After the Fed’s latest chatter, traders eye the next two days for crucial data.
Yields vs. Prices: The Classic Tug‑of‑War
- Yields climb when prices fall.
- Last week’s prices moved only one basis point (0.01 %)—unremarkable momentum.
- Fed comments kept investors on edge, stalling a decisive swing.
What the Fed’s Leaders Are Saying
Federal Reserve Governor Michelle Bowman flagged that the bank isn’t ready to slash rates yet. “We’ll cut once data shows inflation steadily going toward the 2 % target,” she remarked. She didn’t rule out another hike if the numbers warrant it.
Upcoming Data That May stir the pot
- Personal Consumption Expenditures (PCE) price index – Friday
- Durable goods orders – Wednesday
- Pending home sales – Wednesday
- Weekly initial jobless claims – Wednesday
- U.S. Q1 GDP – scheduled for release soon
Because PCE is the Fed’s “go-to” inflation gauge, its reading could hint whether a future rate cut is on the horizon.
India Joins the GBI‑EM Party
From June 28 to March 31 2025, Indian government bonds will grace the J.P. Morgan Government Bond Index – Emerging Markets (GBI‑EM). This move will tweak the global bond scene:
- EM shares in the EMEA region will drop from 32 % to 26.2 % by March.
- Asia’s slice of the index will climb to 47.6 % thanks to the Indian influx.
- Short‑term liquidity hiccups may heat the market temporarily, but generally, low yields stay low.
What Traders Might Do
With rising demand and expectations of rate cuts, yields should fall gradually. For those with a medium‑ to long‑term view, 6–7‑year duration bond funds focused on India and the U.S. are offering a sweet risk‑reward profile.
Market Predictions and the Fed’s Playbook
Right now, the odds for a 25‑basis‑point rate cut in September 2024 sit >65 %. That signals the Fed’s hawkish dial will likely slip off by year‑end. However, if the U.S. economy flounders hard enough, a recession could drag bond prices down—especially if the slowdown isn’t as mild as the Fed hopes.
Technical Angle on US10Y
After last year’s frothy rally, the 10‑year Treasury keeps hovering near 4.28 %. The two‑year bond is almost breakeven, while the 10‑ and 30‑year issuances are eyeing their highest spots in three months. Bottom line: If the trend is your buddy, expect prices to climb and yields to slide, mainly in the medium‑to‑long horizon.
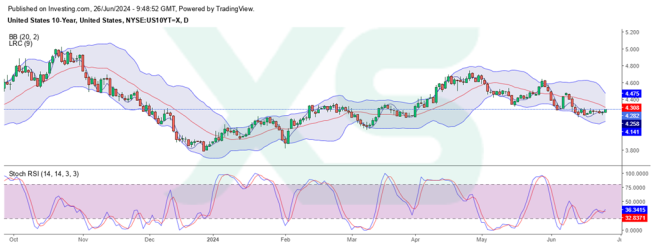
US 10‑Year Treasury Bonds (US10YT) – Daily Price Snapshot
How the Market Is Feeling Today
Yesterday we saw a quick bounce to around 3.82%. That’s a nice little smile after a dip down to a new low. The bond’s price is holding its own on the upward trendline, so the big picture stays solid.
Why the Chart Is a Little Bit Playful
- When the price slid below the key support at 4.20%, it couldn’t keep the momentum and basically “refused to stay low.” It bounced back and kept trading > main trendline.
- In the short term, consolidation is happening between 4.28% and 4.38%. That’s like a balloon slowly filling up.
- Those levels sit below the 5‑day and 21‑day EMAs – a bearish sequence at 4.30% and 4.33%. Think of it as a quiet “ready for a pop” vibe.
- The Stochastic indicator is still rooted in the oversold zone. The MACD is pointing downwards. The recipe? A chance for a deep correction before the long‑term trend re‑takes the wheel.
Support & Reserve – The “Buy” & “Sell” Hotspots
Support levels: 4.28 % → 4.25 % → 4.14 %
Resistance levels: 4.40 % → 4.60 % → 4.80 %
The Bottom Line
Stay tuned for the next swing, because the bond market’s got a knack for swinging from a steady upward march to sudden sharp dips. It’s like a dance floor where the robots sometimes misstep.
Get Real‑Time Updates on Your Device
Want the freshest data at your fingertips? Subscribe now and never miss a beat of the US10YT market action!


