
Oil Prices Take a Minor Setback – Is the Market Feeling the Chill?
Crude oil, the world’s biggest household name, slipped a notch on Monday, trading at $70.78 a barrel after peaking at $71.95 just last week. That’s a bit of a let‑down but still a solid performance for a commodity that can keep people moving—literally.
Why Does It Matter?
- US Economy Flexes Its Muscles: Fresh employment data from Friday shows the labor market rocking strong, proving that the US is still a big, flexible spender.
- Strategic Petroleum Reserve (SPR) Plays Hooky: The U.S. grabbed up to three million barrels of oil, slated for delivery next March—after the SPR hit its lowest level in almost four decades last year.
OPEC+ Cuts vs. Global Supply: A Tale of Two Gangs
OPEC+ said they’re cutting production by 2.2 million barrels per day in Q1 2024, but investors are a bit wary. They wonder if the cuts will actually shrink the global supply bubble.
Meanwhile, non‑OPEC countries might just ramp up production, and there’s even talk of a potential oversupply next year. China, the world’s biggest oil‑importer, may see a contraction, especially as CPI and PPI numbers are sliding below expectations.
China’s Still‑Slow Mobilization
November saw China’s oil imports dip to their lowest in four months. That’s a sign of rising inventories and plummeting demand—think of it as a giant oil tank getting a bit less brimming.
Market Anticipation for the Fed’s Next Move
Traders are keeping their eyes peeled as the Federal Reserve gears up to announce next Wednesday’s policy. Most expect the Fed to hold rates steady at 5.5%, but the market is also on the lookout for the forthcoming API‑reported inventory data (week ending December 8).
Will the Fed’s Decision Shake Things?
Even though the Fed might keep rates unchanged, the inventory data could tip the scales. If inventories shrink, oil prices might get a gentle lift; if they swell, prices could take a dive.
Bottom Line: A Cautious Outlook
- Recent OPEC+ cuts might not be enough to temper the flood of oil from non‑OPEC producers.
- Weaker global demand, especially from China, is adding pressure.
- All these swirling factors suggest that a solid price pop in the near to mid‑term is unlikely.
In short, the oil market is treading carefully—just like we’re all on the lookout for the next big twist in the energy saga. Stay tuned, and keep that portfolio diversified!
Technical analysis of the oil (WTI) prices
Oil Prices Take a Rough Ride
Picture this: the crude oil market feels like a roller coaster without seat‑belts. Buyers keep ordering the down‑slide while sellers pile up on the upswing. Let’s unpack what’s driving this wild ride.
Why the Slide?
- OPEC+ Deadlock: The big oil bloc just can’t agree on how much to cut production. When the group sits at a loss, the price keeps heading downward.
- US Barrel Flood: Washington keeps dumping millions of barrels into the market every day, adding to the already sore competition.
- Short‑Sellers Calling the Shots: Traders are cashing in on falling prices. Short positions keep piling up like a stack of pancakes waiting to be flipped.
How Traders Look Ahead
When you sift through charts, you’ll notice a faint but steady trend of more short trades creeping in. This shows the hot debate: “Should oil prices rise or slump?” The winner? The market, always. Right now, focusing on potential cuts leads many to bet on the dip.
What This Means for You
- Expect Lower Prices – If OPEC+ keeps dithering, the floor price is set to stay low.
- Watch the US Reserve – Any change in the daily releases could spike the already weak market.
- Stay Alarmed – Short‑position trends aren’t a surprise; they are the market’s way of bullishly pulling down the price.
Takeaway
In short, OPEC+ dithering and the US’s generous barrel dumping together paint an almost guaranteed downward trend for crude. Traders who see this curve feel the urge to “sell high, buy low” and hence pile more shorts into the mix. Keep an eye on the numbers and the debate, because the price is likely heading the way you’d expect, given the current market dynamics.
Oil Prices: A Quick‑Guide with a Dash of Humor
Ever feel like oil is a roller coaster? Let’s break down the current playbook for WTI (West Texas Intermediate) on the MT4 platform, courtesy of XS.com.
What to Watch If Prices Keep Pushing Up
- $80.00: Think of this as the “no‑go‑zone.” If oil slips below, that’s a red flag. Hovering near it? Keep your eyes peeled.
- $84.00: Once we clear the 80 mark, the next bump is close to 84. Expect some sellers to pop out, refilling the market with a bit of profit‑taking chatter.
- $93.00: If we manage to hang above 84, the 93 level could act like an over‑excited crowd—prices might surge, but beware the inevitable drop back down.
When Things Turn Downward – The Bumpy Side
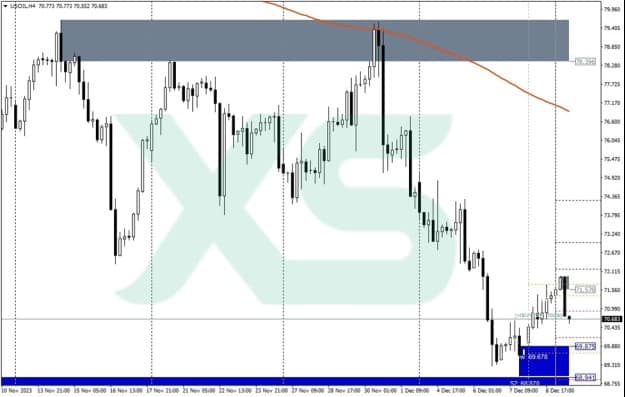
- Support fell: The $74.00 cushion took a hit, and oil is currently eyeing the $70.00 mark—though it already knocked that off earlier in the week.
- $67.00: Cancelling the trip back to 70, the next strong hold is 67. This aligns with June’s triple bottom pattern, which could spark a rally: buying “just because” is a classic move.
- Current Support Ranges: $70.93 $69.90 $67.23 – the steppers in this scenario.
- Current Resistance Levels: $72.07 $72.14 $73.60 – the bullets that might jam the upside.
Need the Latest Shifts on the Hottest Pillars of Oil?
Want to hop on real‑time beats? Subscribe right now and stay in the loop on your device!
Get in the Mix!
Don’t let the market’s waves pass you by—gear up with up‑to‑date insights.


