
Gold’s Wild Ride: From a Decade‑Long Bull to a Cup & Handle
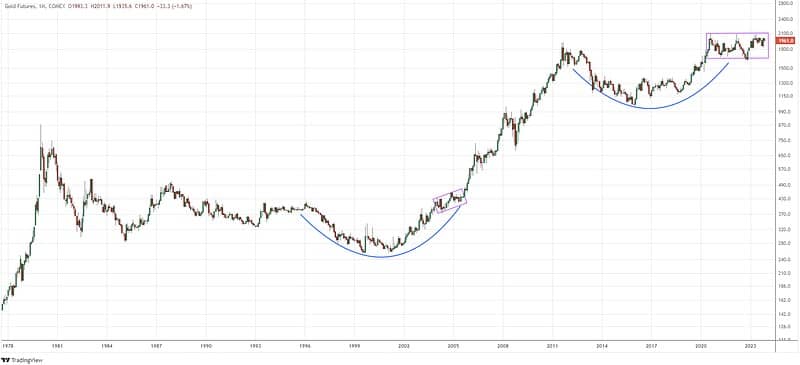
Remember the soaking‑in‑sun 2002‑2011 gold boom? Prices shot up a staggering 660%—the stuff of legends. Then came the 2015 low, plunging 46% down from that golden peak. The dip was deep, but since late 2020 the price’s been clawing back, inching toward that high.
The “Cup & Handle” in Plain English
- Cup – After a massive run‑up, gold pulls back, forming a rounded bottom.
- Handle – The price then steadies, wobbling around the previous high, testing buyers again.
- When the price finally climbs above that handle’s upper boundary, it’s a bullish signal.
Gold’s current pattern has spanned 12 long years. Over the past two years it’s danced around the 2011 high, creating one of the most dramatic cup‑and‑handle shapes any trader will ever see.
What’s the Latest?
- The SPDR Gold Trust (GLD) shows gold has rallied nearly 94% of the 2015 low.
- Still, the big, long‑term uptrend might just be getting started.
- A breakout above the present handle high of $194.45 could ignite the next wave of gains.
Expert Take‑away
Trading.biz analyst Cory Mitchell pointed out a close historical cousin: gold sank 40% between 1996‑1999, hit the previous high by 2003, and then stayed tangled until 2005. After a 75% climb, it was a prelude to a massive 310% rally by 2011. The lesson? A cup isn’t the end; it’s a plot twist.
So if you’re watching gold’s charts, keep an eye on that handle. A breakout could be the spark that finally pushes prices into the next chapter.
Gold’s Current Cup‑and‑Handle: Not Your Average Rally
Gold isn’t playing by the same playbook it did a decade ago.
The recent “cup and handle” looks bigger, sideways, and less smooth than the one that led to the 2000s bull run.
What’s Different?
- No big pre‑handle rally – the last cup didn’t build that “look‑ahead” rally you often see.
- Handle drift – the previous handle rose straight up, this one veers sideways.
- Length matters – the old pattern took ten years from the cup‑top to a breakout; the new one has already been coast‑ing for twelve years.
Potential Upside – 300%? (If $2,100 is the target)
Historical precedent suggests a hefty upside. If gold clears the $2100 mark (the GLD high sits at $194.45), expectations lean toward a 300 % jump. But remember:
- It’s a multi‑year road – the 2000s rally took about six years.
- There will be roller‑coaster dips: after the breakout, declines of 25 % and 34 % could hit before new highs materialise.
- Each dip stalls for at least a year before rallying again.
Risks: The “Sideways” Gambit
Price may stay stubbornly horizontal for months, or it may break – only to stall again and fall. Smelling the volatility? Here’s a quick cheat‑sheet for managing that:
- Set a stop‑loss just below the latest monthly swing low – about $1800 (or $168 on GLD).
- Slightly tighten that stop to shave risk to 10 % or under during a potential mega rally.
Bottom Line
Gold isn’t sailing on a calm tide, but if you keep the risk levers in place, the journey could be spectacular. Stay tuned for real‑time updates about this market trend.


