
Crude Oil Prices Take a Dip – China’s Slowdown in the Spotlight
We’re staring at a gentle slide in U.S. West Texas Intermediate (WTI) crude: the price opened Wednesday at $79.69 per barrel, rubbing shoulders with fresh worries about a possible slowdown in Chinese fuel demand.
What’s Driving the Move?
- Over‑Supply – While U.S. weekly inventories have dipped, the barrel‑bushel surplus in global markets keeps the bulls at bay.
- China’s Q2 – The country’s unexpected ‑slight slip in second‑quarter growth has trimmed any prospects of a future demand boom.
- Dollar Yanks – A stronger dollar makes oil more expensive overseas, pushing prices down.
- Refinery Outlook – Though total crude fell, refined gasoline stocks crept up by 365,000 barrels, and derivatives piled an extra 4.92 million barrels.
The Oil Market’s Mood Board
Oil’s current volatility feels like a rollercoaster driven by the dollar’s twists, Chinese demand jitters, and expectations of a lighter global oil balance heading into Q3. On the Intercontinental Exchange, Brent crude sits just under $85 — a sign that the dollar’s pull and China’s cooling demand are the prime movers for the near‑term scene.
Gas, LNG, and OPEC+ (Because It’s All Connected)
- European Gas – Yesterday’s futures ticked up 1.1%, but inventories are already over 81%. With no major supply hiccups, we’re on track for full capacity by winter, possibly squeezing prices further.
- LNG Worries – The Freeport facility’s post‑Hurricane Beryl lag still lingers, though a slow restart is slated to kick off this week.
- OPEC+ Moves – The alliance is eyeing the end of long‑standing voluntary cuts by the end of September. Smaller members, however, are fighting back: cutting production strains their budgets and threatens market balance.
Regional Drama & a Silver Lining
The flare‑up in the Middle East and the uncertain ceasefire talks in Gaza have added fuel to the volatility. Nevertheless, ongoing OPEC+ cuts and Iraq’s 2024 plans to claw back surplus production could bring some calm in a market battling supply excess and uncertain demand. After all, China’s 2.3% dip in imports for the first half of the year and the U.S. refinery count hitting a low point since December 2021 paint a picture of a market in the midst of a tug‑of‑war.
Bottom Line
Oil will probably stay on a tight, jittery ride until the combined forces of supply policy, global demand trends, and geopolitical shifts align. In the meantime, keep an eye on the dollar, China’s activity, and the ever‑mysterious state of the world’s pipeline network.
Technical analysis of crude oil (WTI) prices
Oil’s Wild Ride: Crude Slides Past the 200‑Hour EMA
Yesterday, crude oil not only dipped below the 200‑hour Exponential Moving Average (EMA)—now sitting at $81.30—but it’s also pumping up the bearish vibes. The drop carried it past the $80.00 cushion, slashing prices by over 5.5% from their July highs to the current low.
What’s Happening?
- Fast‑Track Decline: The quick slide past $80.00 means the market’s on a steep descent.
- Bottom Track: If the recent rally fails to hold, the next stop could be around the 200‑day EMA at $79.07.
- Momentum Matters: With bearish momentum tightening, it’s a grim forecast for the next few trading days.
Why It Matters
Traders who missed the peak in July might now face a wipe‑out, while those who bet on the rebound are looking for a quick exit. The 200‑EMA levels are the new gatekeepers—every breakthrough could trigger more sell‑pressure.
Bottom Line
Oil’s currently chasing a sharp drop. If the support at $80.00 cracks, the 200‑day EMA might soon be the new no‑go zone for both buyers and sellers.
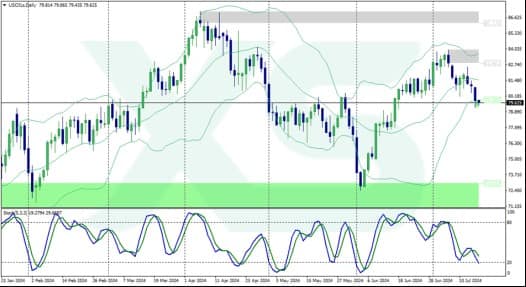
Crude Oil Update – WTI on a Wild Ride
Today’s WTI price dip to $79.62 marked the lowest point in three weeks. It’s hovering just shy of the 38.2% Fibonacci retracement of the recent wave that stretched from $72.46 to $84.50—right inside the daily Ichimoku cloud’s upper boundary. So far, the moves are all over the place, with no clear direction.
What the Numbers Tell Us
- Strong Bearish Flag: A solid break below the $80.00 and $79.60 marks could be a green‑light for traders expecting a slump, especially after a bearish wave pattern wrapped up on the daily chart.
- Support to Watch: If prices keep easing, you’ll likely see a slide toward around $78.71.
- Upper Limit: Any rise that spikes past the $81.66 level (the 23.6% Fibonacci retracement) might hint at a budding rebounce, but that’s all the ice‑cream for now.
- Long‑Term Trend: Above the 200‑day EMA at $79.27, we’re in the “bear” zone. If the price dips under that, the dip could push toward the early June low near $72.45—time to brace.
Quick Reference
Support: $79.20 $78.77 $78.00
Resistance: $80.20 $80.55 $82.00
Stay in the Loop
Want real‑time vibes on this market? Sign up and get the fresh updates delivered straight to your device—no article lag, just the fuel for your trading fire.


