
Oil Prices Take a Tiny Tumble
At the crack of yesterday’s market opening, oil slid to $77.39 after the U.S. Producer Price Index showed weaker demand hints. It’s a classic case of investors checking the weather forecast before rolling out the tanks.
IEA’s Warning About Oversupply
- IEA flagged a big risk of oversupply, especially with OPEC gearing up to loosen its production cuts.
- They noted OPEC’s output rose by 250,000 barrels per day over the prior month, led by Saudi Arabia and Iraq.
Can OPEC Hold the Line?
“If OPEC pulls the plug on the planned boost,” the analyst mused, “we could see up to 920,000 barrels per day of extra inventory next year—thanks to a generous U.S. supply.” The U.S., with its summer demand surging, might dip reserves, but investors are keenly watching weekly inventory updates.
Geopolitical Drama Keeps Prices on Their Toes
- Potential Iranian aggression toward Israel flares the market’s fire.
- The U.S. Department of Defense is moving a missile submarine to the area, signaling nerves are high.
- In the far east, Russia’s mass evacuations in Kursk and Belgorod amid Ukrainian advances add a dose of global instability.
Even with this tension cocktail, oil saw a minor dip at the day’s start—likely because risk appetite dipped and stock markets, especially in Japan, gave a little bounce.
What’s Next? Inventory Data Is the Holy Grail
The upcoming U.S. Energy Information Administration (EIA) report is crucial. After six straight weeks of falling inventories, another confirmation could light up demand zones and push prices higher. Meanwhile, OPEC+ continues to slash production—3.66 million barrels per day extended until the end of 2025, with extra voluntary cuts till September. That’s already taken pressure off global inventories.
Short-Term Outlook
Despite the hiccup, sentiment stays positive. The IEA’s alert about potential inventory declines in the last quarter adds a layer of uncertainty, but supply pressure is likely to linger in the near to medium term, giving oil a bullish short‑term trajectory.
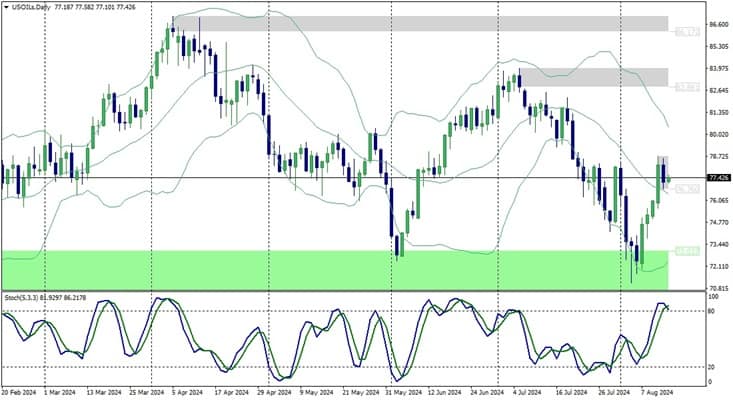
Technical analysis of crude oil (WTI) prices
Market Snapshot: Quick Look at Moving Averages
Alright, here’s the low‑down on what’s happening with the price action right now. We’re looking at a couple of critical moving averages that could shape the next move.
Positive Outlook
On the upside, the 55‑day Simple Moving Average (SMA) hovers around $78.56, while the 100‑day SMA sits at $79.83. If the price manages to slice through that 100‑day line, you might see a quick burst past the $80 mark. That would be the green light for a push towards a sentimental target of roughly $87.12—our ultimate goal for the rally.
Negative Side
Conversely, let’s not forget the 200‑day SMA, which is currently acting as a safety net amid some ongoing profit‑taking. If the market isn’t feeling bullish, the next magnet could be around $75.27. Keep your eyes on that level because any bearish fundamentals that arise could force the price to test a deeper support around $72.00.
Key Levels at a Glance
- 10‑day Average: $78.56
- 20‑day Average: $79.83
- Target for breakout: $80.00
- High‑hope target: $87.12
- Support from 200‑day SMA: $75.27
- Potential deep support: $72.00
That’s the quick snapshot. Keep an eye on those averages and see how the price navigates the next few days. Good luck out there!
Crude Oil: The WTI Roller‑Coaster of the Day
Daily Snapshot
Crude oil’s mind‑trip has settled around the $80.00 ceiling—like a tightrope walk over a canyon. If it faints at this edge, a dip back toward the $72.50 low is likely. That low is our trusty mid‑term safety net. But should the price stubbornly climb over $80.00 and stay above it for a full day, the bullish vibe would kick into high gear, potentially pushing towards an $87.00 peak.
Four‑Hour Pulse
Last Friday, the price tore through the first big bearish trendline and started buzzing with liquidity. It’s currently hovering near the $78.70 resistance and trendline junction. For a real bullish surge, the price has to breach and sit comfortably above this zone. If that happens, we may witness a medium‑term pullback from the high water mark.
Hourly Wrap‑Up
A rising trendline squeezed around the $77.30 level is loosening the current bullish tension. If things go south, the price will likely cling to that trendline for support while trying to break through resistance. Conversely, a drop could fuel bearish momentum toward support levels near $70.00.
Key Support Levels
- $76.74
- $76.20
- $75.40
Critical Resistance Levels
- $77.75
- $78.30
- $79.20
Stay tuned for the latest ticks. Subscribe now for real‑time updates straight to your phone!


